Challenges and Opportunities in Data Visualization Education: A Call to Action
Benjamin Bach, Mandy Keck, Fateme Rajabiyazdi, Tatiana Losev, Isabel Meirelles, Jason Dykes, Robert S. Laramee, Mashael AlKadi, Christina Stoiber, Samuel Huron, Charles Perin, Luiz Morais, Wolfgang Aigner, Doris Kosminsky, Magdalena Boucher, Søren Knudsen, Areti Manataki, Jan Aerts, Uta Hinrichs, Jonathan C. Roberts, and Sheelagh Carpendale
Abstract
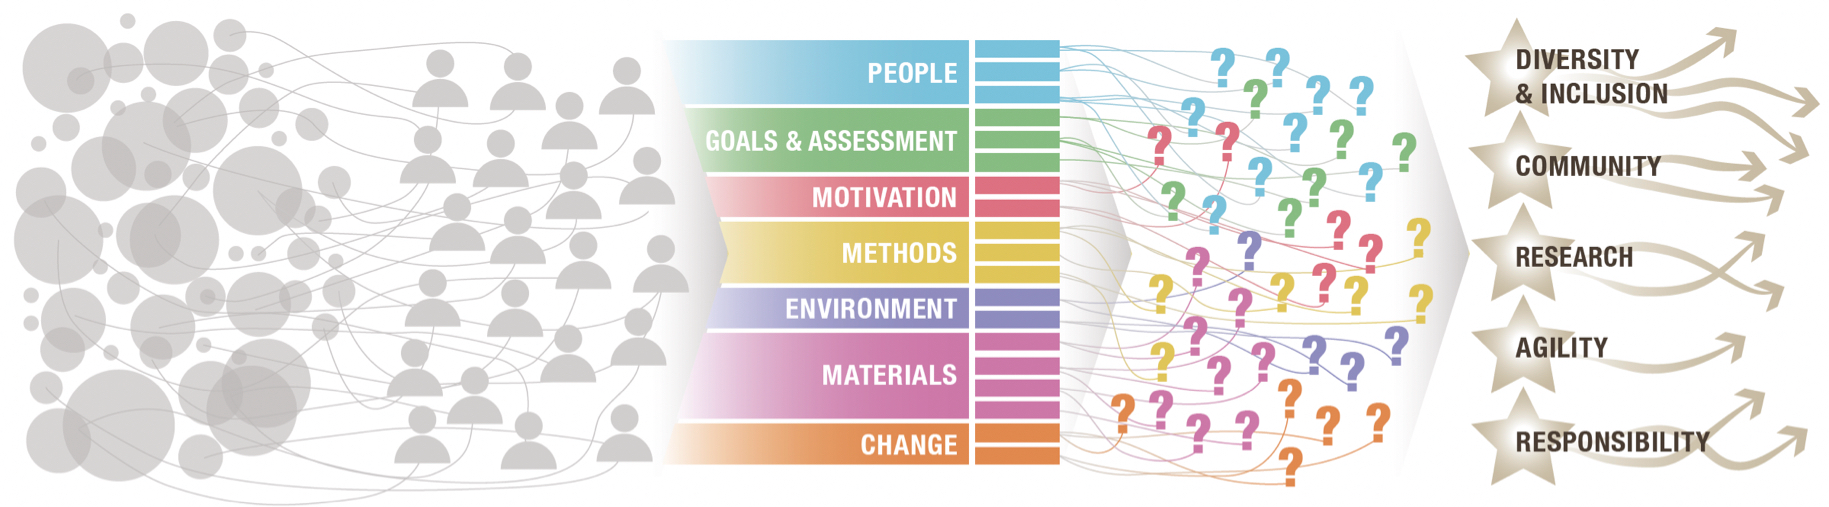
This paper is a call to action for research and discussion on data visualization education. As visualization evolves and spreads through our professional and personal lives, we need to understand how to support and empower a broad and diverse community of learners in visualization. Data Visualization is a diverse and dynamic discipline that combines knowledge from different fields, is tailored to suit diverse audiences and contexts, and frequently incorporates tacit knowledge. This complex nature leads to a series of interrelated challenges for data visualization education. Driven by a lack of consolidated knowledge, overview, and orientation for visualization education, the 21 authors of this paper-educators and researchers in data visualization-identify and describe 19 challenges informed by our collective practical experience. We organize these challenges around seven themes People, Goals & Assessment, Environment, Motivation, Methods, Materials, and Change. Across these themes, we formulate 43 research questions to address these challenges. As part of our call to action, we then conclude with 5 cross-cutting opportunities and respective action items: embrace DIVERSITY+INCLUSION, build COMMUNITIES, conduct RESEARCH, act AGILE, and relish RESPONSIBILITY. We aim to inspire researchers, educators and learners to drive visualization education forward and discuss why, how, who and where we educate, as we learn to use visualization to address challenges across many scales and many domains in a rapidly changing world: http://viseducationchallenges.github.io/.
Cite as
-
Bach, Benjamin, Mandy Keck, Fateme Rajabiyazdi, Tatiana Losev, Isabel Meirelles, Jason Dykes, Robert S. Laramee, Mashael AlKadi, Christina Stoiber, Samuel Huron, Charles Perin, Luiz Morais, Wolfgang Aigner, Doris Kosminsky, Magdalena Boucher, Søren Knudsen, Areti Manataki, Jan Aerts, Uta Hinrichs, Jonathan C. Roberts, and Sheelagh Carpendale. "Challenges and Opportunities in Data Visualization Education: A Call to Action." arXiv preprint arXiv:2308.07703 (2023)
Bibtex
@article{bach2023challenges,
  doi = {10.48550/arXiv.2308.07703},
  url = {https://arxiv.org/abs/2308.07703},
  author = {Bach, Benjamin and Keck, Mandy and Rajabiyazdi, Fateme and Losev, Tatiana and Meirelles, Isabel and Dykes, Jason and Laramee, Robert S. and AlKadi, Mashael and Stoiber, Christina and Huron, Samuel and Perin, Charles and Morais, Luiz and Aigner, Wolfgang and Kosminsky, Doris and Boucher, Magdalena and Knudsen, Søren and Manataki, Areti and Aerts, Jan and Hinrichs, Uta and Roberts, Jonathan C. and Carpendale, Sheelagh},
  keywords = {Data Visualization, Education, Challenges},
  title = {Challenges and Opportunities in Data Visualization Education: A Call to Action},
  publisher = {arXiv},
  journal = {arXiv preprint arXiv:2308.07703},
  year = {2023},
  selected = {1}
}